operational performance analytics

the challenge
The problem:
HMCTS and CPS did not have adequate processes and systems to measure their performance. So they could not proactively improve the efficiency of their services. M.I. was slow to come and could only be used retrospectively.
The broad goal:
To provide the business with the means to extract, analyse and report on data and information from the Common Platform system.
The broad desire:
To enable users to understand how well they are performing against performance metrics; measure current and previous performance; and help highlight the most urgent actions to take
The MoJ wanted to have ways of monitoring efficiency across HMCTS and CPS activities in order to act in ways which led to improved operations across the organisations
From passive to active help from data
The broad solutions:
Data Supply – extract Common Platform data into a single view store and provide HMCTS and CPS with a data feed to meet agreed requirements
In-System Reporting – provide operational staff with the means to manage the business on a day to day basis, assisting in the planning and allocation of work
Cross-Domain data – work with the domain design facilitator to identify and support the resolution of cross-domain data issues. Data protection and IdAM
Main issues:
- This was new to MoJ. "Faster horses may have been ordered from Mr Ford"
- Users have different needs and aptitudes
- New roles and hierarchies are rolling out
- Geographical dispersion of the organisation and their different ways of working
- HMCTS and CPS look at very different aspects of the same information
- "M.I." is usually an afterthought
- A brief had to be created as the users are not sure what they need
- No legacy system
- No historical data to analyse
Why Me:
I have a unique skill set and the right experience for this project:
- CX - built and managed teams of different skill sets including UX, UI, dev, analytics and content
- Personally created dashboards to support CX
- UX designer
- User Researcher
- Data - Analysis and visualisation, R Programming, Tableau, D3 JS
- Animator - 2D, 3D, Film
- Agile
- Jobs-To-Be-Done evangelist
A UCD Approach:
Planning:
Hypotheses and research question
Operational work could be made more efficient with the provision of transactional and performance analytical data
Data visualisation could improve the digestion and cognition of analytical information for operational users
There is a need for near to real-time data analytics for decision-support
Is consistency really needed across HMCTS and CPS reporting
The users
MoJ
HMCTS
CPS


What would success look like?
A decrease in manual data input via automated activities and shared data
A decrease in the amount of time analysts spend collecting and preparing data for regular tasks and reports
Improved flow of cases and materials through processes
Improved notification of threshold breaches
How would we manage changing needs and evaluate them periodically?

What’s the plan to design a solution?
Research
Design
Build
Test
Repeat
How do we go beyond the "brief"?
GDS data viz pattern libraries
Machine learning (e.g. schedulers), AI and automation. Semantics.
Conversational UI
Configurable data feeds and filters
Micro UX
gamification
1. The research plan:
Identify & Collect KPIs
Benchmark Perceptions of UX Quality (supr-q)
Associate UX Measures to KPIs
Identify & Track Top Tasks
Prioritise Based on KPIs
Plan to Improve
Compute ROI
Regular UX Audit

2. The solution strategy & design process


Design Sprints


research
The Users and participants
The users
- Key stakeholders
- Service Managers
- Operations Managers
- Operations administration staff
- Prosecuting Agencies
Who else was involved
- Product owner
- Business architect
- Technical architect
- UI developer

IdAM
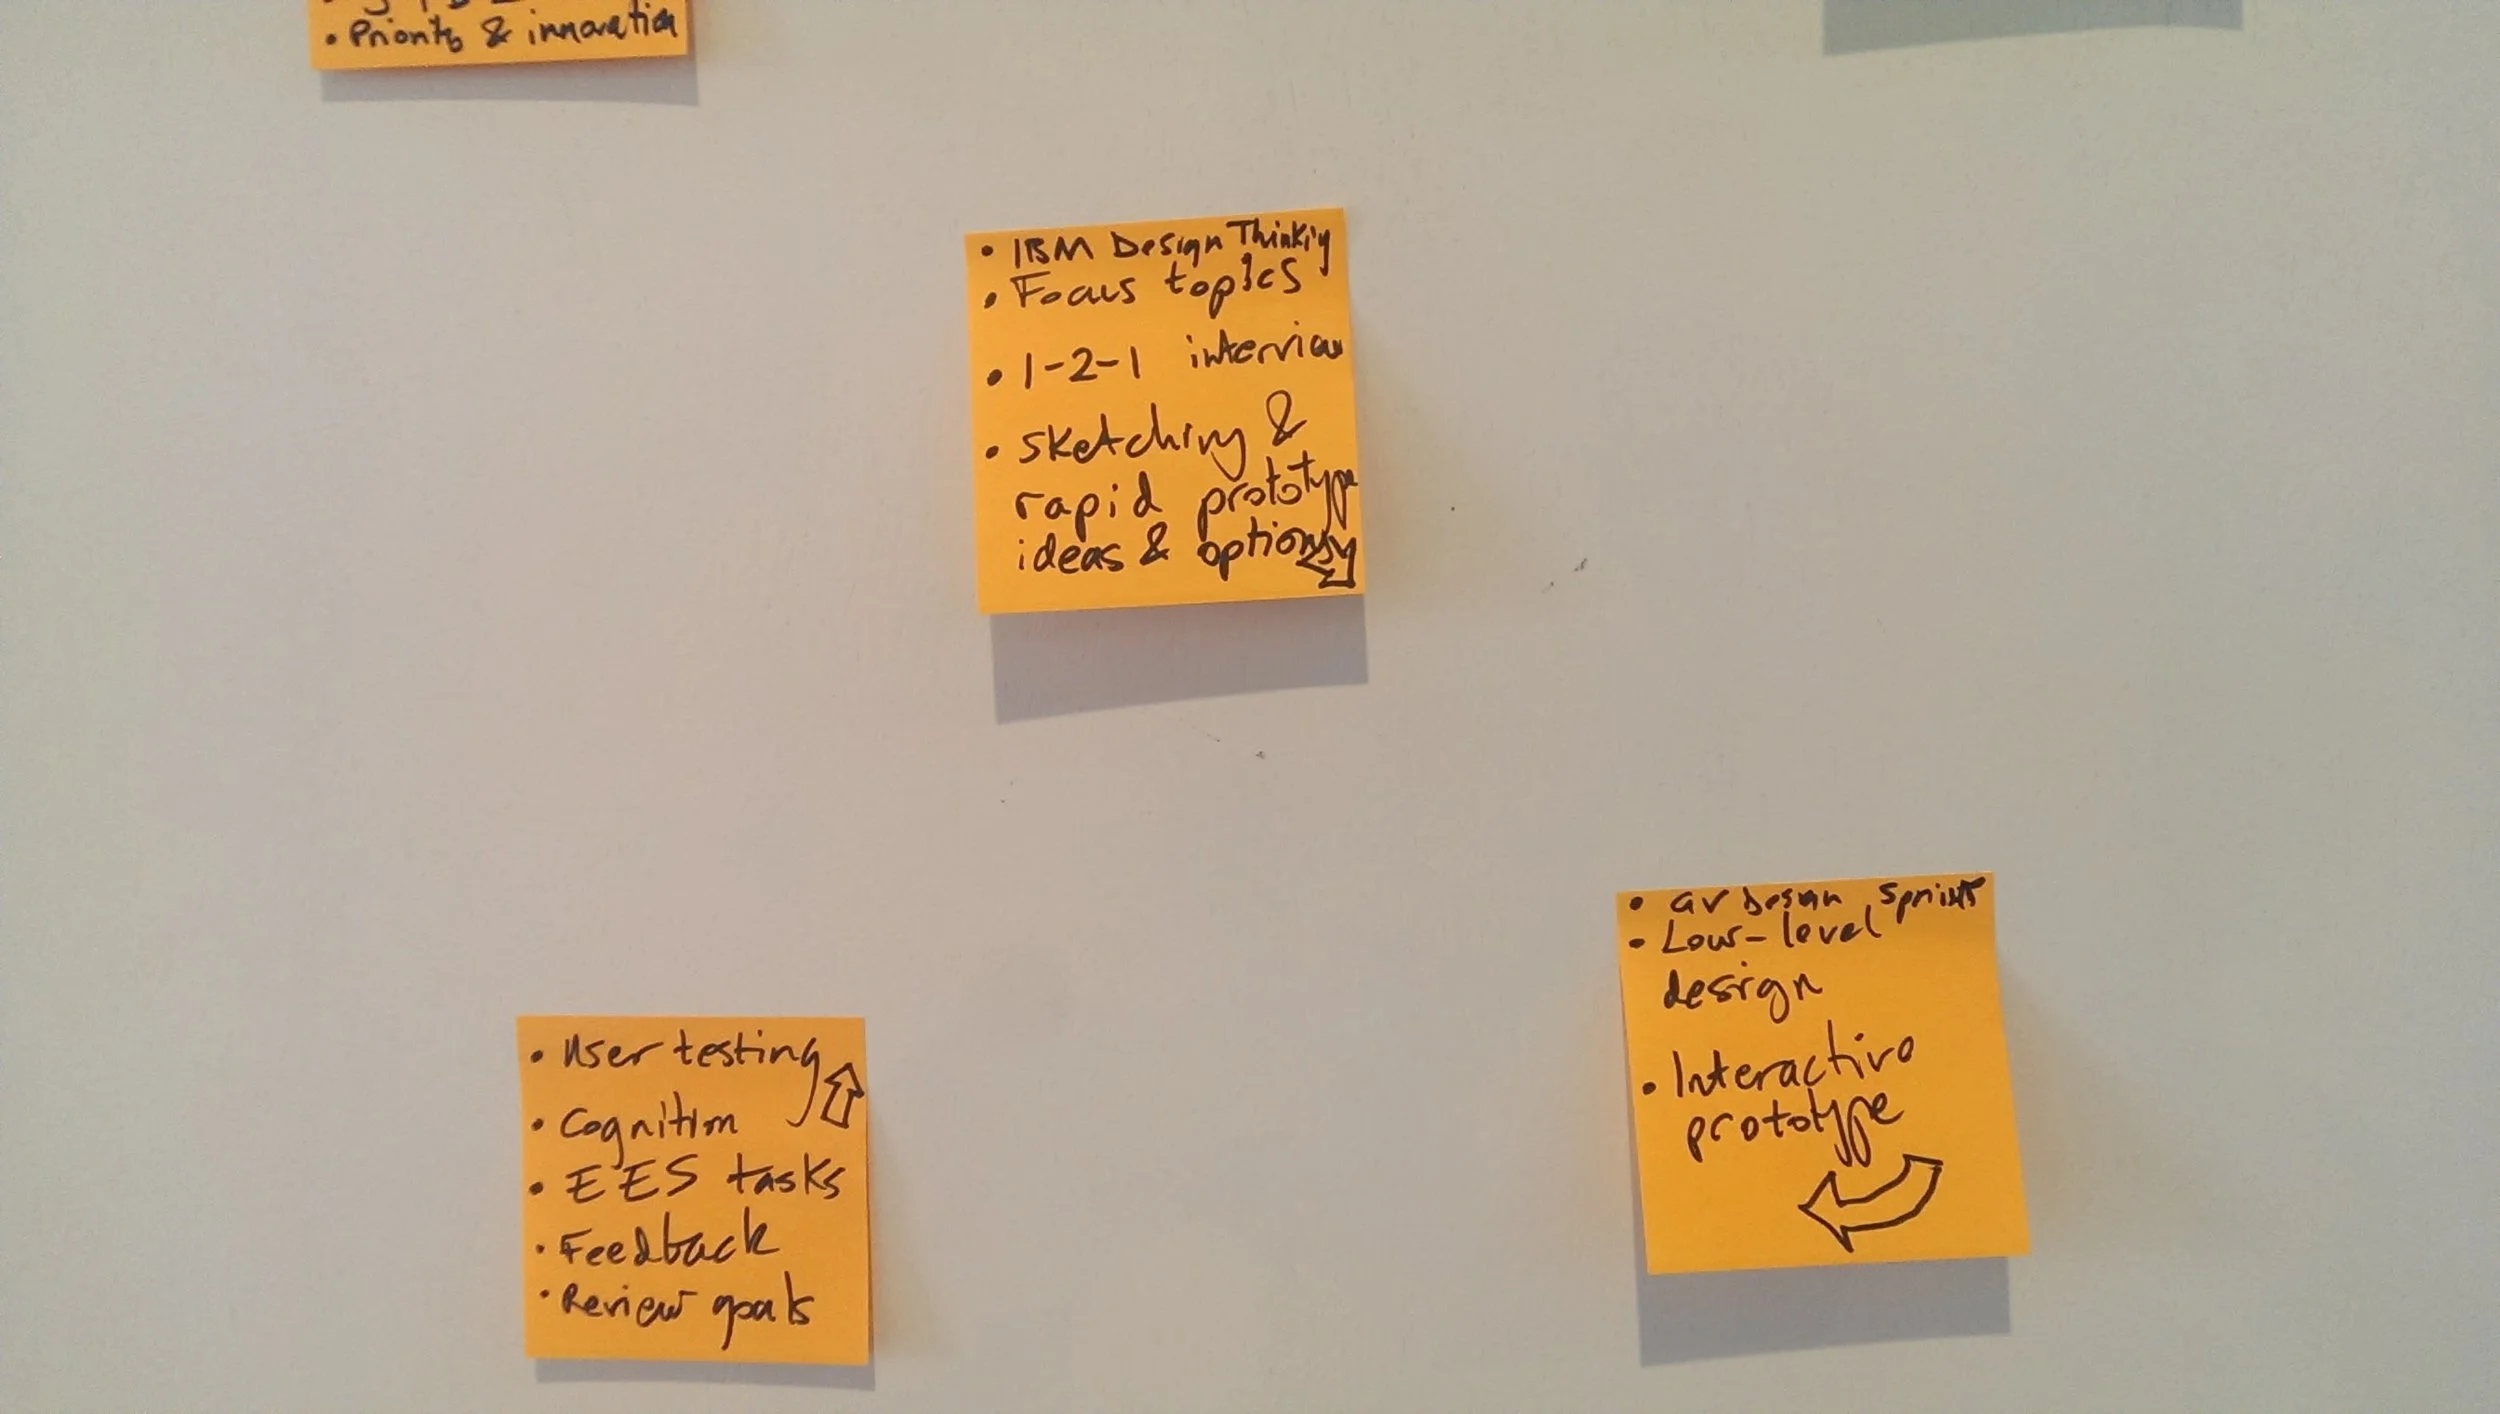
formative research
Workshops & Interviews:
Exploratory activities - 6 hats, card sorting, affinity diagrams, mental models, JBTD
Follow-up plans with individuals or smaller group interviews


Previous knowledge and gap analysis
- Took stock of previous work that had been done on the subject
- Identified valid requirements and added them to current research

Innovation Opportunities
- Used the JOBS-TO-BE-DONE framework to make requirement gathering more accessible
- Gathered opportunity points and ranked them by importance and satisfaction
- Highlighted areas for rapid innovation and improvement
- Wrote R-programming scripts to handle mass survey analysis


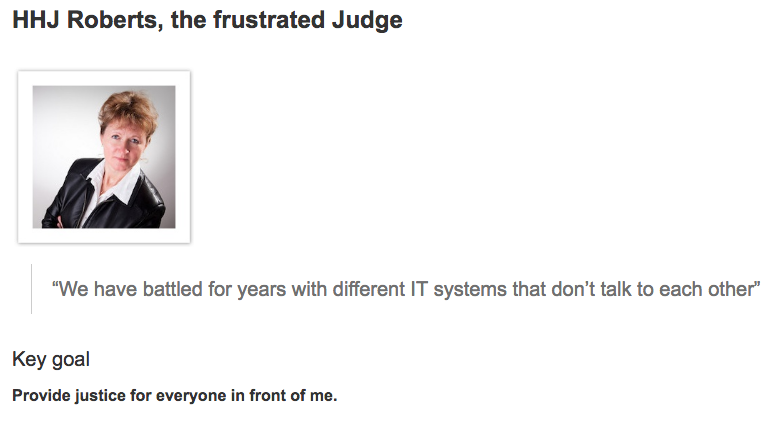
Telling the story
- Catalogued user pain points and scenarios in entertaining formats
- Documented user flows and usage of systems via technical diagrams
- Confirmed or discarded hypotheses
- Set benchmarks for periodic evaluation


Judge-to-case scheduling process

CX Benchmarking analysed in R and visualised in GGplot2
The design process
IDEO Lean UX

Google Ventures Design Sprints
Sketching Sessions
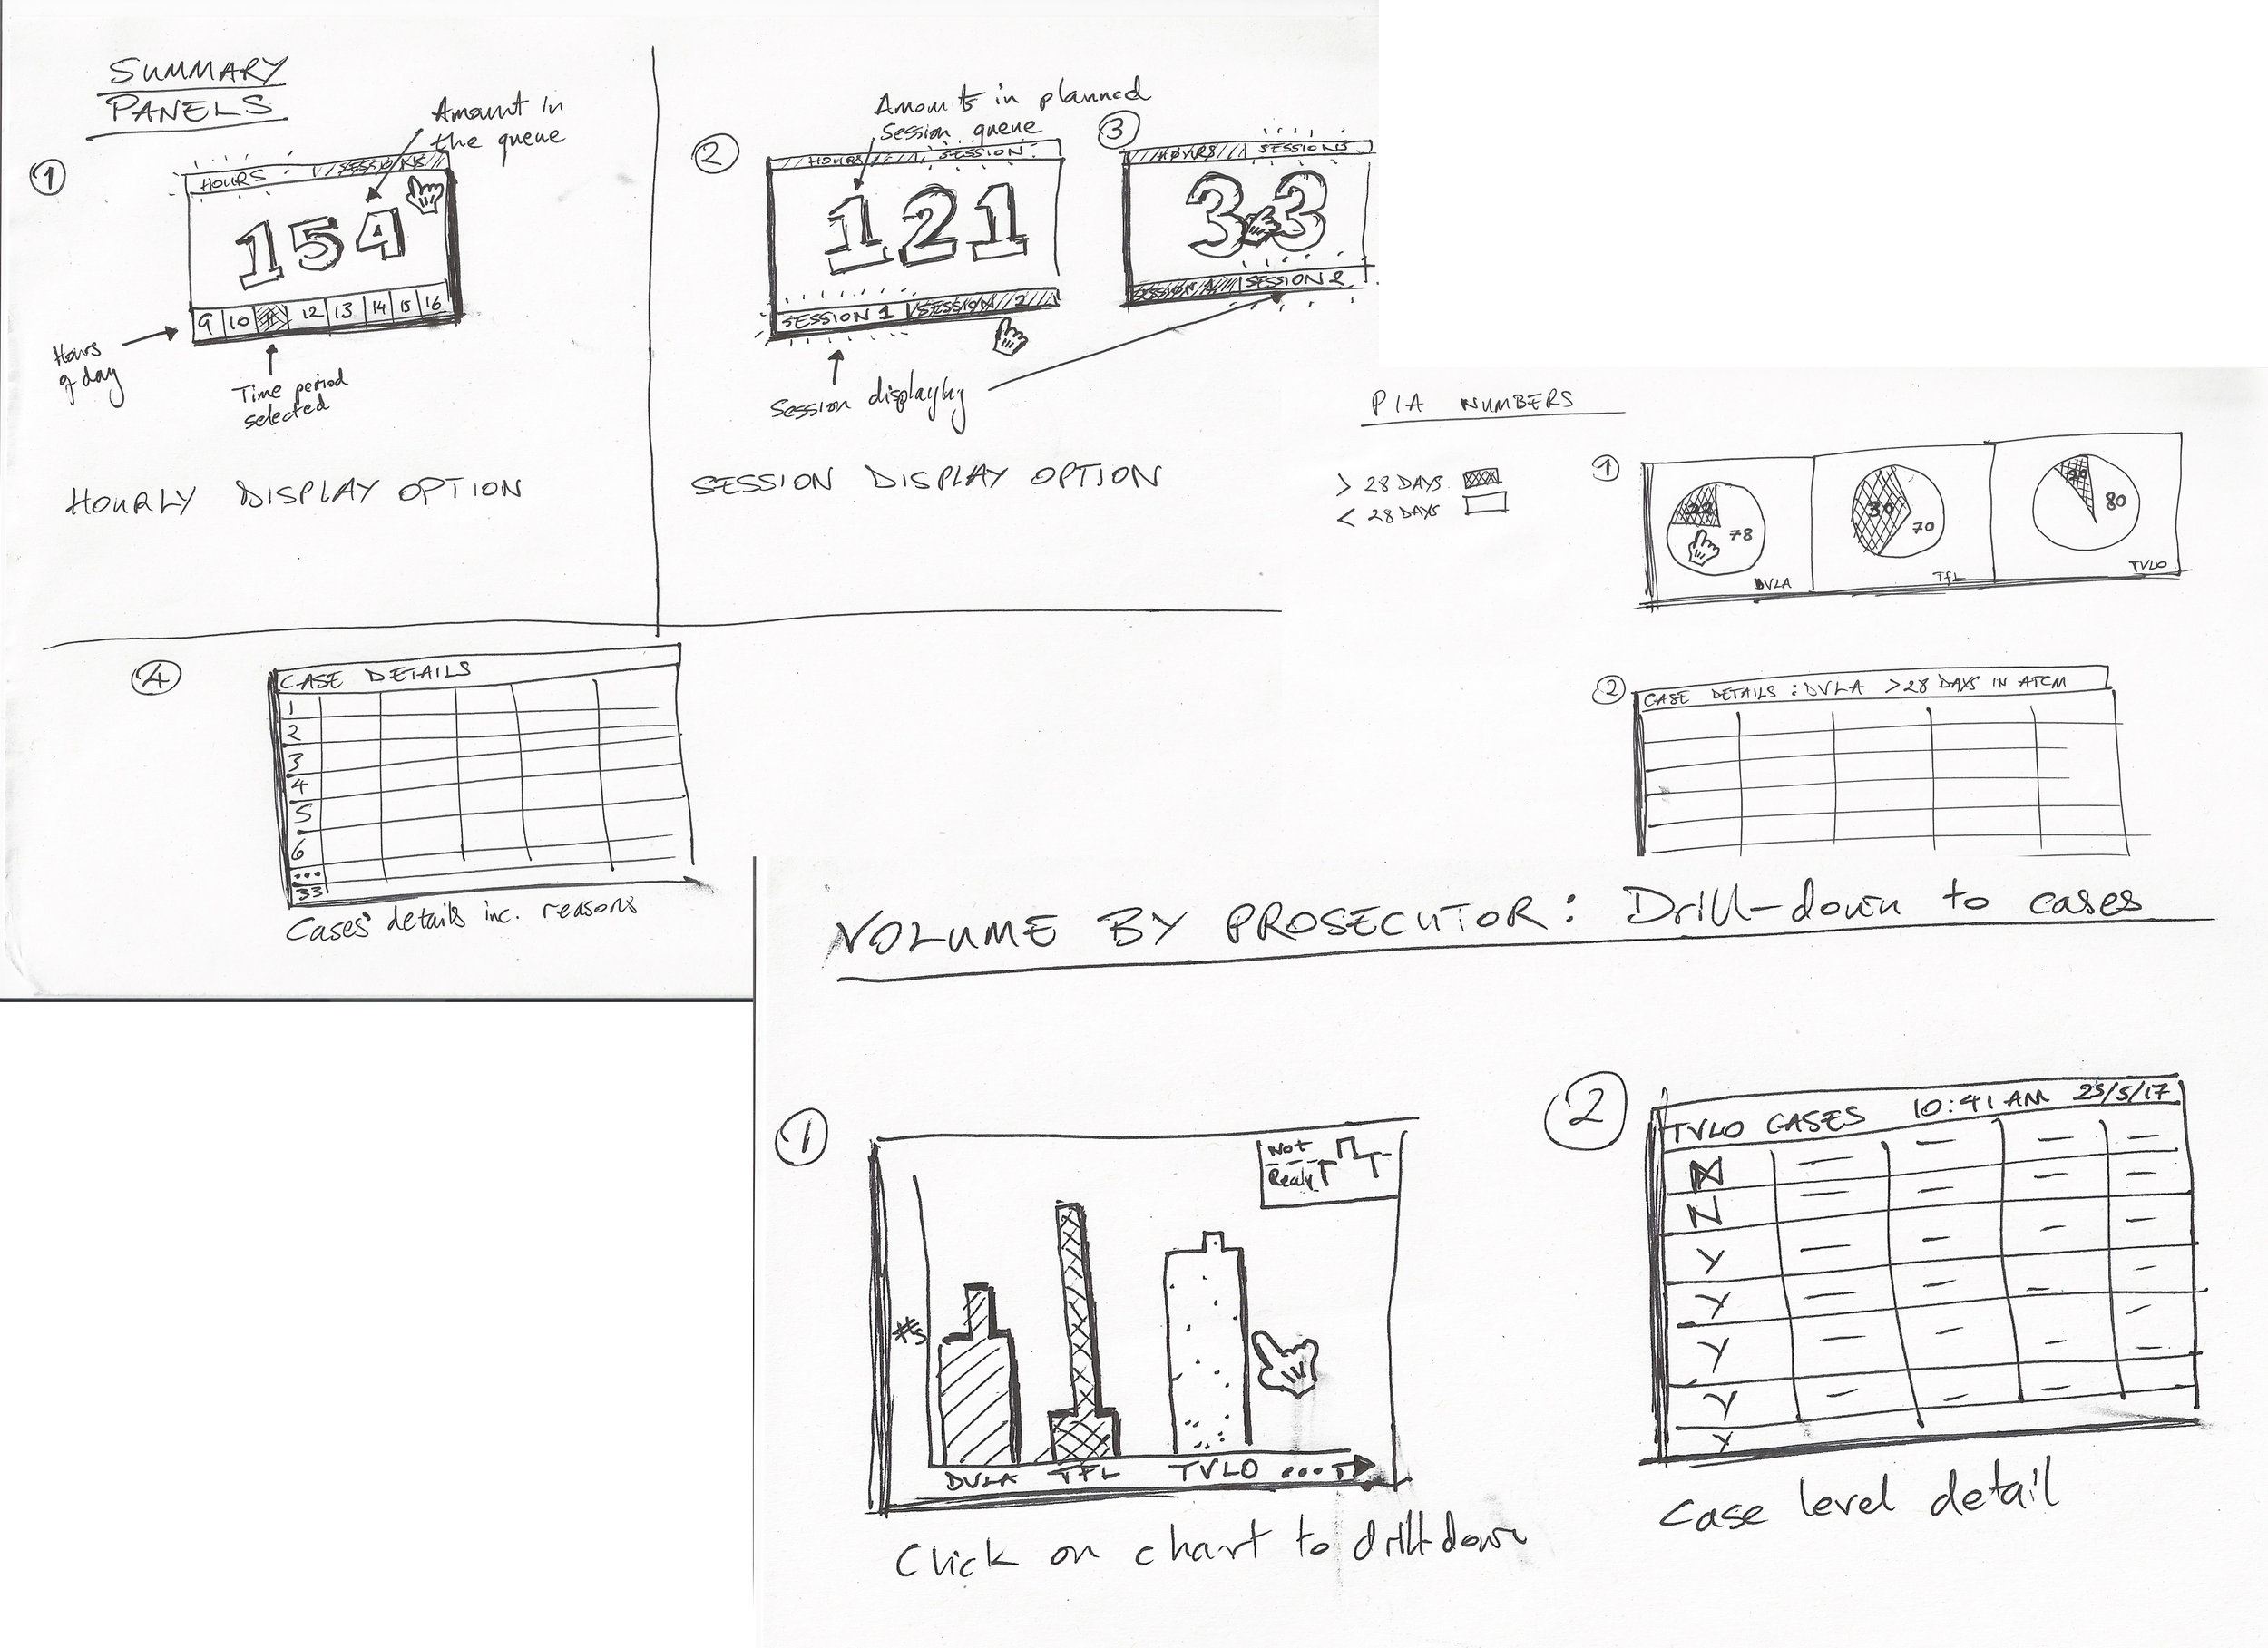
Simple models
- VOLUMES - How many things do I have to deal with?
- TIMELINESS - How am I performing against SLAs?
- EXCEPTIONS - Are there any items I need to be notified about which are breaching thresholds?
- VARIANCE - Is this something to worry about
- Dashboards - all in done screens
- In-System Reporting - in-situ relevant data

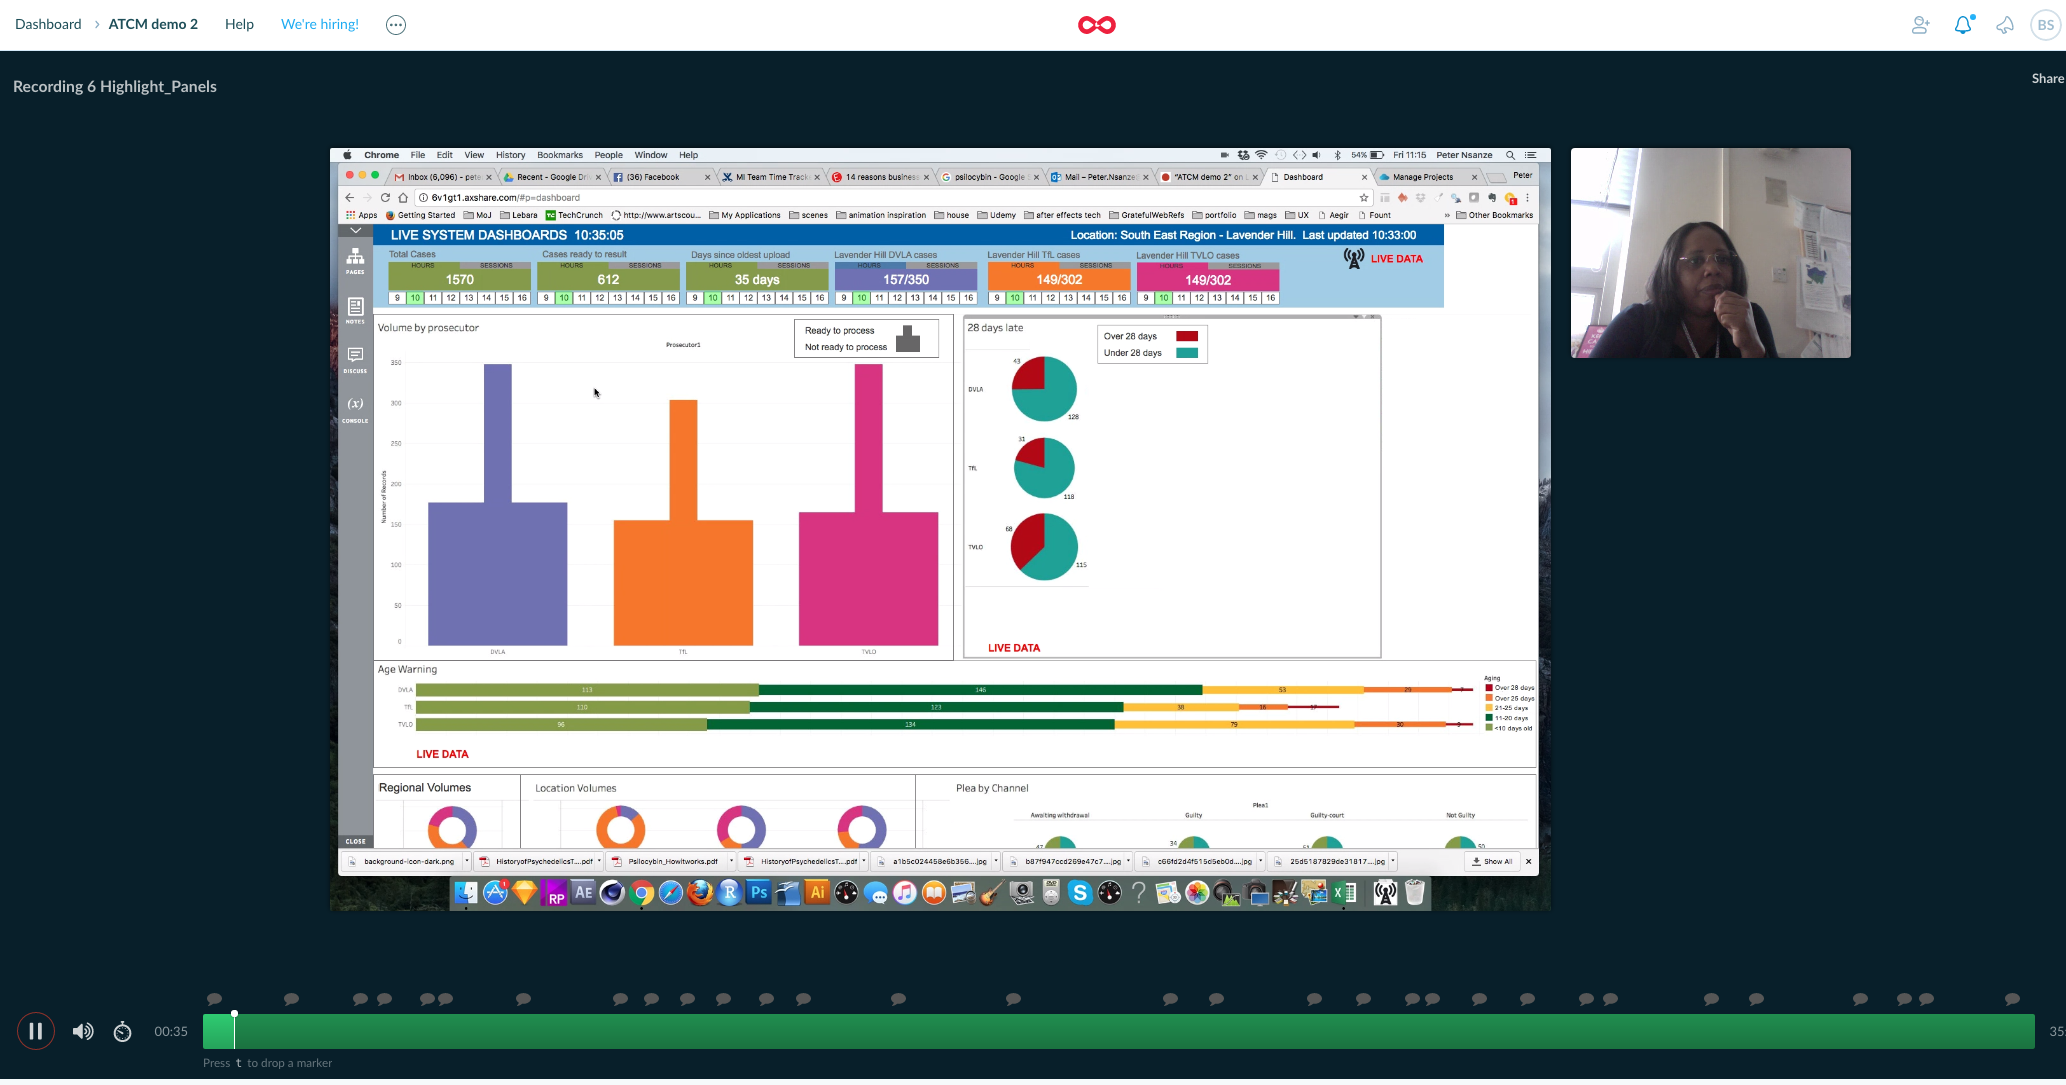
summative research
Interactive prototyping and testing


iteration

& iteration...iteration...iteration...


...AND iteration!!


Quality of the experience
"I was wading through treacle before these"
"I used to have hundreds of cases that breached SLA before I had any warning"
"You've saved me 6 hours a day collecting, counting and recounting things"
"Now I'll be able to see which channels of communication are ineffective and I can fix them"
How do we go beyond the scope?
- GDS data viz pattern libraries
- Machine learning (e.g. schedulers), AI and automation. Semantics.
- Conversational UI
- Configurable data feeds and filters
- Micro UX
Next steps
- Build a library of assets
- Work with the Common Platform to extend tool set
- Integrate modules across the GDS landscape